What if…The Premier League awarded reward points for English players

The two targets I have for the England team are – one, to at least reach the semi-finals of Euro 2020. Two, win the World Cup in 2022.

When the new FA Chairman Greg Dyke made his keynote speech a couple of weeks ago, it prompted a lot of discussion and debate in the media about what could be done to support, renew and develop English football, and in particular the England team.

Picture2

Sadly, the majority of the debate was about apportioning blame rather than finding solutions.

The blame was attributed to the usual suspects; grassroots football had its customary (and very poorly informed) hammering, the Premier League got more than its fair share of finger jabbing and even the good old English weather got a mention.  Did I dream about the article that said England should stick to what we’re good at – blood and thunder, long ball football?  Hope so.

Buried within the tosh though was a Talksport radio show (I think it was the Drivetime show with Adrian Durham and Darren Gough) where they were actually trying to seek a solution.  A lot of the suggestions that listeners were calling in with were unworkable, some due to European law, some due to human rights and some due to plain old greed.

However, one guy had an idea that I quite liked.  He proposed that the Premier League could encourage the Premier League clubs to select and play more English players by rewarding them with points.  This would result in more English players getting more top level experience providing the England manager with more to select from.  Genius!

Of course it’ll never happen but it got me thinking, would the points on offer make any difference to clubs position in the league?

So let’s do it, lets recalculate the Premier League with Reward Points.

The Method

Each Premier League team has played 4 games at the time of writing this so I’ve looked at each teams weekly match squad and counted the number of English players that made an appearance each week.  This includes substitute appearances.

Next we need to decide the level of points that are awarded.

Over the years I have taken huge enjoyment from seeing some of the worlds best foreign players grace the English leagues, from Ravanelli to Klinsmann, Cantona to Zola and Veron to Boogers.

Picture11

Ok, maybe some duffers have snuck in too, but we want the quality foreign players to keep coming though don’t we?  Therefore I think it would be reasonable to suggest that a fair amount of English players playing for a team each week is 6, from a maximum potential 14 (11 + 3 subs).  If each team fielded 6 English players each week that would give us 120 English players getting the much needed game time.

A nice round (and pretty arbitrary) figure for a points reward would thus be 0.25 per player – 6 English players x 0.25 points = 1.5 points reward.

For every English player that plays in a Premier League game, I will reward the team with 0.25 points.

The Numbers

(Click for interactive detail)

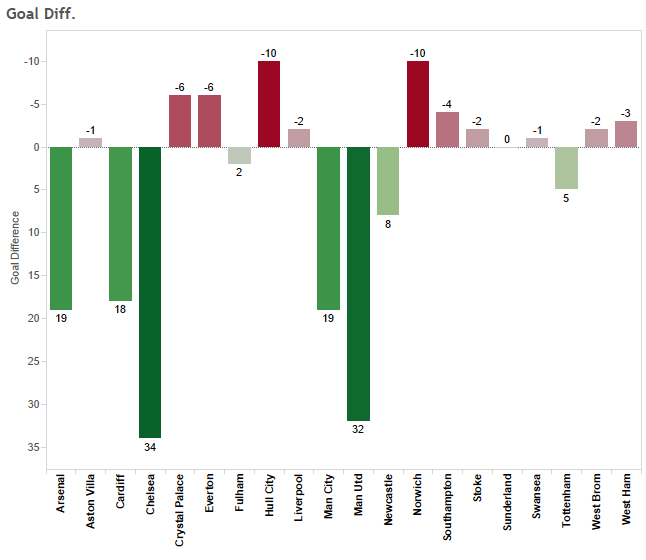
At a glance it seems pretty obvious that Newcastle United and Swansea aren’t doing much to help the cause.  Ironically, the biggest supporter of the England team is Cardiff.  Thanks Cardiff.

The overall figures so far are as per the chart below:

(Click for interactive detail)

The next job is to multiply these appearances by 0.25 to gain an overall Reward Points score.

Picture3

As we knew, Newcastle are left embarrassingly behind in the potential supply of England players and Cardiff and Manchester United lead the way.

And so to the main point of the article, would reward points make any difference to the Premier League table.  The table, with these reward points added, would look like this:

Picture4

Whilst the top spot in the table doesn’t change, 15 out of the 20 clubs do actually change positions.

The biggest winner is, unsurprisingly, Cardiff City with a climb of 5 places (and into a European place).  As expected, Newcastle suffer the most, dropping 7 places with Man City not far behind, dropping 6 places themselves.

Conclusion

Doing a hypothetical exercise like this does actually highlight a few flaws within the plan.  For example, Sunderland gain points for playing Kieran Richardson, however, despite him still only being 28, it is unlikely that he will have an impact on the future of the England squad.  The same can be said for a number of English players (Rio Ferdinand, Joe Cole and Peter Whittingham).

Overall, I like the idea, and the potential benefits of it. If it was applied to the Premier League, and each team fielded 6 English players, there would be a difference in only 4 weeks of +129 English appearances.

Picture13

Sadly, it’s never going to happen, and if it did there is still no guarantee that it would impact positively on the England team.  My solution is for every England youth team from u16 to u20 to get together at St Georges Park for 1 week every month to spend time with the England coaches, receiving England specific training (tactics, style, formation etc).  This would need the cooperation of all the clubs but would create a future pathway for England players who had trained and played together for an extended period.  The result being a unified approach across all of the England teams.

But, hey, thats just me.

What if QPR had signed Messi?

Back in January I wrote a hypothetical article contemplating where Hull City would be if they had signed Pele (original article here).  As I’m now getting bored waiting for the new season to start, I thought i’d have some fun and see what might have happened if QPR had signed the best player in the world, Lionel Messi.

images Fantasy Stats Blog: Could Messi Have Saved QPRs Season?

So here’s how it works:

  • Messi scored a goal every 57 minutes in the Spanish League last season
  • I assign Messi’s goal ratio to an existing QPR player
  • Goals only count if the QPR player was on the pitch at the same time Messi’s goal ratio dictates (i.e. every 57 minutes)
  • If the player had actually scored in a game where Messi’s goal ratio dictates a goal scored, then only one of the goals count
  • Points and goal difference are recalculated to create a new end of season table.

The player I have decided to replace is Adel Taarabt, for two reasons.  One is that Taarabt is an attacking player and it would be crazy to swap Messi with, say, Clint Hill.

Secondly, Taarabt played the most minutes at QPR last season of any attacking player and actually (along with Clint Hill) played the most number of  games.  To digress slightly, the centre forward with the most appearances is Bobby Zamora with 21, followed by Djibril Cisse with 18.  Compare that with the other Premier League strikers and it tells a story in itself:

31 Fantasy Stats Blog: Could Messi Have Saved QPRs Season?

(click for detailed view)

An example of how this works:

In the first game of the season, Taarabt played 90 minutes in a 5-0 defeat to Swansea.

Obviously he didn’t score.  However, by replacing him with my fictional Messi, QPR did score, in the 57th minute.  Sadly, the only difference this makes is to the goal difference.

Here we go then, the following are last seasons fixtures, with actual and ‘Messi’ figures:

Picture1 Fantasy Stats Blog: Could Messi Have Saved QPRs Season?

Hooray for Messi!

The Messi factor has made the difference in 15 out of the 38 games with 4 losses being turned into wins, 9 draws becoming wins and 2 losses being turned into draws.

The slow start, i.e. no points difference in the first 7 games is due to Taarabt not playing in 4 of them, meaning that Messi didn’t play either, and the fact that Taarabt scored in the following 2, thus cancelling out Messi’s goals.

An alternative view of the QPR points gain by team is below:

21 Fantasy Stats Blog: Could Messi Have Saved QPRs Season?

(click for detailed view)

Messi’s QPR profit the most against Reading and Wigan (4 points apiece) whilst the teams that didn’t have any points difference include Swansea, Fulham and Arsenal.

Coincidentally, QPR now end the season with the same amount of points as Messi’s goals per minute ratio – 57.  Don’t you just love it when numbers do that!

As well as a huge points difference, the goal difference also increases dramatically with an extra 34 goals.

Now the bit we’ve been waiting for, the recalculated league table.  This is what the league table may have looked like if QPR had signed Lionel Messi:

Picture42 Fantasy Stats Blog: Could Messi Have Saved QPRs Season?

So there we have it, the answer is a resounding YES, Messi would have kept QPR in the Premier League.  Not only that but  his goals would have propelled them up the league into 8th!

As well as QPR, 2 other teams would profit from QPR’s success, these being Chelsea and Southampton due to an improved goal difference, however Norwich and Stoke are worst hit (in terms of position) both dropping 3 places.
Of course, the actual team that suffers the most is Newcastle, dropping down into the Championship (thanks to Mike for pointing out my original oversight in not taking GD into account when creating the table and condemning Sunderland to relegation).

Whilst all of the above is fantasy, there is an important message there for the teams that are coming up into the Premier League this season.  Sign Messi.  Simple.  And if you can’t sign Messi, sign someone else who will score 34 goals.

There’s loads of them available.  Aren’t there?

The first 4 games – Premier League forecast

It’s getting closer! The new Premier League season is only 4 weeks away and the excitement is building.  Transfers are being made, kits are being released and season passes are being sent out. Squads are all back to undertake their pre-season training.  Some are going on (quite frankly, crazy) pre season tours to the Far East, Australia and America, others taking it a little easier with jaunts around Europe.  All aiming to get themselves in perfect shape, both physically and mentally, for the long season ahead. I wanted to have a look at which teams, historically, start the season well and which teams take longer to get out of the blocks.  I therefore compiled the following information for the first 4 games, over the past 4 years of the teams that will be competing in the Premier League this season:

  • Won
  • Drawn
  • Lost
  • Goals for
  • Goals against
  • Goal difference
  • Points
  • Percentage of overall points at end of season

There weren’t a huge amount of massive shocks, but there are a number of little surprises. This post doesn’t take into account the difficulty of opening fixtures or the league that the teams were in over the past 4 years, purely the figures as stated above. So firstly, here’s a dataviz showing who has gained the most points from the first 4 games over the last 4 years and the total number of goals scored:

11 The First 4 Premier League Games: Analysis of results for last 4 Years

Chelsea are slightly ahead of Man Utd in the points stakes (44 v 38), however, Man Utd lead the way with 47 goals.  The lowest points scorers are Norwich with 16, with Hull City and Norwich slightly ahead with 18 apiece.  Unsurprisingly (as a Hull City fan), they are the team that have scored the least amount of goals, with only 13 in 16 games.  Interestingly, the bottom half of the points gained list are only seperated by 6 points, whilst there is a 20 point gap between West Brom in 8th (24 points) and Chelsea. The biggest surprises in this list are Cardiff, who are 3rd best points scorers, gaining an impressive 34 points in their first 4 games over the 4 seasons and Liverpool and Everton who are 13th and 15th respectively, suggesting that they do start seasons slowly.  Cardiff will no doubt be hoping for a similarly strong start to next season. Next, a quick look at games lost and goals conceded:

2 The First 4 Premier League Games: Analysis of results for last 4 Years

As expected, Chelsea fare well in this list too (as it is almost a reverse of the last), having never lost in their first 4 games of the last 4 years.  They have also conceded the least with only 8 goals, 5 less than Man City their closest rival.  Crystal Palace hold up the bottom, having lost 9 of their 16 games, with Hull City and Southampton not far behind on 8. Always looking for a way to bring Hull City to the fore, here’s a chart they lead in:

3 The First 4 Premier League Games: Analysis of results for last 4 Years

Sadly, it’s not a great one to be showing….. Now that the Totals have been viewed, its worth having a quick look at what percentage of clubs end of season points have been picked up during the first 4 games:

4 The First 4 Premier League Games: Analysis of results for last 4 Years

The chart shows that Man City are way ahead in respect of percentage of points gained in the first 4 weeks.  A consistent team across the seasons would show an average of 9.5%, therefore the further away that teams get from this, either positively or negatively, the less consistent they are. Finally I have looked at the averages over the past 4 seasons in order to try and predict who will start next season strongly:

7a7 The First 4 Premier League Games: Analysis of results for last 4 Years

So based on the average over the last 4 seasons, Chelsea will end the first 4 games at the top of the league with 11 points (yes, i’m aware they can’t get 11 points in 4 games but thats averages for you) whilst Man Utd will lead the goalscoring charts with 11.75 goals.  Cardiff will be top 3 and Everton and Liverpool will be playing catch-up to Stoke. The league table, after 4 weeks and based on the averages, will look like this:

62 The First 4 Premier League Games: Analysis of results for last 4 Years

Of course, the above table won’t happen.  That’s the beauty of football, it is unpredictable and it is that unpredictability that we love. Although, Chelsea being at the top of the EPL after 4 games has to be worth a punt, doesn’t it?

Managers – Experienced or Progressive?

At some stage, within every single club forum, there will be a comment that states “…we need an experienced manager” or a version thereof.  This got me thinking, and caused me to ponder a few questions:

  1. Does experience really matter when recruiting a manager?
  2. Are modern methods more relevant than experience?
  3. Does managerial performance improve with experience?

What i’m trying to do is raise some debate around whether modern management / coaching methods & a deeper academic knowledge of the game are as valuable as experience or does experience trump all?

There are a number of things to consider before I start trying to tackle the questions.

Firstly, from being children we are taught that “practice makes perfect”, which is an adage that I wholeheartedly agree with.  However, when preparing for a maths test for instance, is it better to spend 10 hours taking similar tests or spend 10 hours learning the formulas required to take the test?  I’m afraid I don’t have the answer but hopefully you’ll see where i’m coming from.

Secondly, my dad has 30 years more experience of maths than me.  If we were to take the test together, he would use his experience and knowledge to tackle the questions, whereas I would use a calculator.  I wouldn’t like to speculate who would score higher, but IN YOUR FACE DAD!

Finally, what would happen if I gave my dad the calculator?  Would he use it?  Would he be able to use it?  Or would it sit unused on the desk?

Lets take a look at the experience of the coming seasons Premier League managers:

Picture21 Experience v Progressive   Managers in the EPL | Stats Analysis

The average length of experience for Premier League managers next year will be 11.9 years.  In my opinion, and for the purpose of this post, an experienced manager is one who has over 10 years experience, .  Therefore, 11 of the 20 managers can be classed as experienced.

By the way, if experience was the be all and end all, the table above is also the final Premier League table for the 2013/14 season.

Of course, football doesn’t work like that.  Which reinforces question 1, does experience really matter when recruiting a manager?

The chart below shows next seasons Premier League managers in the order that they finished this season:

Picture3 1024x5761 Experience v Progressive   Managers in the EPL | Stats Analysis

7 of the 11 experienced managers (with 10 or more years as a manager) finished in the top 6 of their respective leagues last season.  That’s 64%, whereas only 2 (34%) of the ‘inexperienced’ managers managed the same feat.

Does this mean that experience wins?  It almost does, however clubs that are expected to be challenging for major honours are more likely to be risk averse and rely on the traditional ways of appointing managers meaning that opportunities for inexperienced managers to join a club that is expected to challenge (and has the resources to) are reduced.

Is the nervousness of the so called ‘big clubs’ justified?  After all, both Spurs & Liverpool were brave enough to appoint inexperienced managers with a modern football approach and the general consensus is that they have both done decent jobs last season.  Their level of success next season will be interesting to see and they both have room to have better seasons without having to challenge for the top 2.

But, (frustratingly) this then raises another question.  Will any improvements next season be as a result of their modern approach to football or because of their extra years experience?

My view is that the only way to gauge whether a manager has been successful or not is to look at their final place v pre-season (or pre-employment) objective.  6 (54%) of next seasons 11 experienced managers either achieved or over achieved in 2012/13 (including Laudrup at Swansea, Allardyce at West Ham and Bruce at Hull City).  However, 6 (67%) of the 9 inexperienced managers at least achieved their objective (Steve Clarke at West Brom, Pochettino at Southampton and MacKay at Cardiff for example).

I’m coming to the conclusion that a mixture of both is the right answer which is a real wimps way out!  As a believer in modern techniques in football and making full use of technical advances I will always favour a thoughtful, educated manager with a background in the deeper side of the game rather than a blood and thunder ex-pro who relies on his many years of management experience to get him a job.

Nick Levett (@nlevett), the FA National Development Manager for Youth Football posted the following on twitter a couple of days ago:

Capture Experience v Progressive   Managers in the EPL | Stats Analysis

Capture2 Experience v Progressive   Managers in the EPL | Stats Analysis

Capture3 Experience v Progressive   Managers in the EPL | Stats Analysis

Having considered his points, its hard to disagree with him.

In essence, the appointment of a manager has to be based on a number of things, experience & management / coaching style being just 2 of the considerations.  I think we are certainly going to see a new breed of manager coming through in the next 5 to 10 years with a complete understanding, and appreciation, of technology, statistical analysis and modern coaching styles and maybe some of the ‘dinosaurs’ will disappear.  There will be less & less demand from fans for an experienced manager, and more for an educated, innovative and progressive type that will help lead (or drag) clubs into the future.

Personally my natural instinct is leaning towards the Villas-Boas / Rodgers type of manager rather than a Pardew or Hughes.

Which kills me as a Hull City fan!

Do Manager changes guarantee success?

The twenty Premier League teams for next season are very close to being finalised, with the final place being decided this weekend in a £120m game between Crystal Palace & Watford.  Both clubs have had new managers in the last 10 months and both are (almost) reaping the rewards.

This means that 15 of the 20 teams that will be competing in the Premier League next season will have changed their Manager in the previous 12 months:

  • Manchester United
  • Manchester City
  • Chelsea
  • Everton
  • Tottenham Hotspur
  • Liverpool
  • West Brom
  • Swansea City
  • Norwich City
  • Stoke City
  • Southampton
  • Aston Villa
  • Sunderland
  • Hull City
  • Crystal Palace or Watford

Its important to note that not all of these changes are as a result of a manager being sacked, indeed 4 of them were as a result of managers moving on to ‘bigger’ clubs, 1 due to retirement and 1 to take on the England managers job.  However, regardless of the reasons for change, I wanted to look at the impact of the new manager taking over and also what will be expected of the new managers next season.

I think it’s fair to state that when a club hires a new manager the minimum that they expect of the replacement is an improvement in the team performance. In essence, if an outgoing manager has won 10 points in the previous 10 games, the new guy has to get 11 out of the same number of games, doesn’t he?

In order to assess the improvements that arise from a new manager coming in, I’ve done a comparison of the newbies that were introduced by Premier League clubs either before or during last season against their predecessors, over the same amount of games. For instance, Paolo Di Canio managed Sunderland for 7 games so I have compared this against Martin O’Neills last 7 games.  Of course there may be a difference in the quality of opposition over the 7 games, however these are purely as a result of scheduling and club chairmen are aware of the games coming up anyway.

 (I have restricted the comparison to the teams that were playing in the Premier League in the 2012/13 season).

Picture241 1024x545 Premier League Managerial Changes: Do They Guarantee Success? Stats


In pictorial terms there’s no-one that really jumps out as having a huge impact compared to the previous manager.  In fact, only 1 manager bettered their predecessor by more than 2 wins, Paul Lambert at Villa with 3 more wins by Alex McLeish.  So does that mean that Lambert was the best Premier League replacement last season?  The next chart shows the overall points difference by club:

Picture311 1024x654 Premier League Managerial Changes: Do They Guarantee Success? Stats


So, compared to their predecessor over the same number of games, Brendan Rodgers comes out on top with 9 points more than Dalglish (38 games) and Paolo Di Canio follows in 2nd by gaining 6 points more than Martin O’Neill (7 games).

Despite all the plaudits and praise that Michael Laudrup has received, even being touted for the Everton job in some media reports, he actually finished 1 point behind Rodgers 11/12 Swansea points.  Laudrup did however manage this whilst delivering a net transfer spend of +£10,709,600 versus Rodgers -£10,907,600.

Chris Hughton will no doubt be delighted with finishing 11th in the league, despite finishing 3 points behind Lamberts Norwich side the previous season.  Those 3 points would have given Norwich a 9th place finish.

To give a better ‘at a glance’ view, the following shows Points per Game:

Picture421 1024x586 Premier League Managerial Changes: Do They Guarantee Success? Stats

When Martin O’Neill was sacked by Sunderland there were a lot of comments on Twitter questioning the decision, and particularly the timing of it.  Clearly his last 7 games giving a PPG of just 0.29 was rotten.  Di Canio managing 1.14 PPG seems to justify the decision.

Interestingly, the same questions were asked about Southamptons sacking of Nigel Adkins.  The fact that Pochettino managed exactly the same record of wins, draws & losses as Adkins (over the same amount of games) means that the questions remain unanswered.  The only positive influence that Pochettino has had so far is that Southampton conceded less goals (20 v Adkins 25).

So, 5 of the 8 managerial changes delivered positive improvement.  Only time will tell if they can continue to do so next season.

There will be (at least) 5 Premier League clubs with new managers next season so, in closing, I wanted to take a quick look at the challenges ahead of them (2012/13 figures):

Picture531 1024x170 Premier League Managerial Changes: Do They Guarantee Success? Stats

Clearly David Moyes has a huge (almost impossible) task ahead of him, having to emulate (and quite frankly to better) Sir Alex.  In fact, none of the jobs look easy.  The only one where I would be confident enough to put money on an improvement is Chelsea, and only if Jose Mourinho does go back.

There will no doubt be lots of interest in the Stoke job as it appears it requires the lowest level of success to have an impact.  However, they are clearly keen to move into a more ‘continental’ style of football and shrug off their reputation of being a ‘typically English’ kind of team.  To do this will they will need to recruit a foreign manager, or at least a British manager with a continental style, and how many of them will be looking to take on the ‘project’.  I wouldn’t be surprised though to see Zola’s name linked if Watford fail to gain promotion.

Stoke & Zola, a match made in Heaven.

Do substitutes win games? – Premier League

We’ve all been there.  Your team is a goal down, with 20 minutes to go and you know the only way to get a result is to make substitutions.  But how many?  And who?  Once the changes have been made you can sit back and wait for the sub to score the goal that may salvage a point.  They always do.  Don’t they?

The substitution is the final throw of the dice, and often the sign of a desperate man(ager).  Whilst there are a number of reasons that substitutions may be made (injury, as a result of a red card, to strengthen the defence), the majority are made chasing a goal.  Or two.

I wanted to know how often subs score?  How likely is a substitutes goal to make a difference to the distribution of points at the end of the game?  And which managers are the best at making them?

Therefore the purpose of this post is to evaluate the ‘impact’ of subs, my definition of an impact being when a sub earns a point (or points) for their team and to see what the Premier League table would look like without these impacts.

So far this season (up to 15th April), there have been 1734 substitutions in the Premier League, out of a maximum possible 1938 (89%).  The breakdown is as per the chart below.

Picture1 Do Substitutes Win Games? | Premier League 12 13 Stats Analysis

Clearly some teams have played more games than others and have therefore had the potential to make more subs, therefore the chart is better viewed as a percentage of potential subs.

Picture21 Do Substitutes Win Games? | Premier League 12 13 Stats Analysis

As is clear, Mancini prefers to use all of his subs, using all 3 in every game this season apart from the 0-0 draw v Chelsea at Stamford Bridge, whereas Brendan Rodgers has only used 76.77% of his available substitutions so far.  Does this signify a lack of confidence from Rodgers in his substitutes or, alternatively, supreme confidence in his starting 11?

Only once this season has a team made no substitutions in a game, West Brom in their 3-1 defeat to Swansea at the Liberty Stadium.  This is interesting as all 3 of Swansea’s goals were scored within 39 minutes, meaning there was plenty of time left to make changes and possibly benefit from an impact, something that Steve Clarke decided against.

Next we will take a look at the timings of substitutions..

Picture3 Do Substitutes Win Games? | Premier League 12 13 Stats Analysis


The majority of substitutions are made in the last 15 minutes of games and, surprisingly, only 14% are made in the first 15 minutes of the 2nd half.  This suggests that managers are prepared to wait for 15 minutes to see whether their half-time team talk has had any impact on their teams.  Only when it becomes clear that it hasn’t do they ramp up their substitutions.

Now we know who uses subs and when subs are made we need to look at the number of goals scored by them.

Picture4 Do Substitutes Win Games? | Premier League 12 13 Stats Analysis

Of 1734 substitutions made, only 87 of them resulted in a goal, or just over 5%.  Obviously some of these substitutions will have been defensive or even goalkeeper substitutes, however I am only interested in goals as a result of subs.

The team having the most success at gaining goals from substitutes is Reading with 10 goals from 84 substitutions (11.90%).  I’m sure we all remember LeFondre coming off the bench 2 weeks running and scoring a brace in both games.  The team with the poorest goals to substitutions is Sunderland with only 1 goal from 88 substitutions (1.14%).  Does that help to explain why Martin O Neill has recently been sacked?

Whilst only 14% of substitutes are made between 46 & 60 minutes, the majority of substitute goals are scored by subs that are introduced in the 46th minute (9), the next optimum time to make a substitution is 68 minutes, with 6 goals coming from subs introduced at that time.

The key time for substitutes to score is within 5 minutes of them being introduced, over 29% of goals are scored in a substitutes first 5 minutes on the pitch.

As mentioned earlier however, there is a difference between a sub scoring a goal and the goal making a difference to the final distribution of points.  For example, Chelsea subs have scored 5 goals this season, yet none of these goals have made any difference to the number of points they have received, i.e. zero impacts.

Picture5 Do Substitutes Win Games? | Premier League 12 13 Stats Analysis


Reading continue to top the table, with 7 impacts from their 10 goals and Man City second with 6 impacts from 9 goals.  Chelsea, Wigan, Southampton, West Brom & Sunderland have had no points changing impacts from substitutes so far this season.

Converting the impacts into overall points won at the end of the games then gives us a definitive view of who is benefiting the most from the use of substitutes.

Picture6 Do Substitutes Win Games? | Premier League 12 13 Stats Analysis

With 15 points gained as a result of substitutes impacts, Man City are gaining the most from their use of substitutes.  I would suggest this isn’t much of a surprise as they generally have a very strong subs bench to choose from, however, so have Chelsea and they aren’t benefiting from it all.

Interestingly, 4 out of the top 5 teams in the impact table (with the exception of Reading) are in the top 5 for total substitutes used.  Therefore, my advice for the use of substitutions would be as follows:

  • Use all of your substitutes, every game
  • Make your first sub in the 46th minute
  • If they haven’t scored within 5 minutes of coming on, replace them.  In the 68th minute.

The last thing to do is look at the Premier League table with the points resulting from substitutes impacts removed.

Premier League Table 1024x621 Do Substitutes Win Games? | Premier League 12 13 Stats Analysis

The biggest losers without substitutes impacts would be Man City, dropping a massive 4 places down the table and whilst both Villa & Everton would climb 3 places apiece, Wigan would also breathe a sigh of relief climbing out of the bottom 3.

Managers will always call on substitutes to change games, even though only 5% score and only 2% have an impact on the final distribution of points.  Who’d be a manager eh?!

What if half-time didn’t exist – Premier League

As I get older I am finding that I am becoming less interested in the players at clubs and much more interested in the managers.  What do they do?  Are they worth the money?  Are they actually needed at all?

Once the team is picked and the tactics discussed, is there anything that a manager can do to influence the game?  Does barking instructions from the technical area make any difference to the game?  Can the players even hear them anyway?  Are the gesticulations and  wild hand & arm movements that managers love so much a pre-planned, secret, baseball-esque code that only their players understand?   My guess would be no.

This means that realistically there are only 2 ways that managers can have an impact on games.  Half-time & substitutions.  Therefore I’ve taken a simple look at the effectiveness of half-time in turning a losing game into a points winning game, and which teams are better at it.

Firstly, the chart below shows the number of games that teams have been in a losing position at half-time.

 What if half time didnt exist... | Premier League Stats Analysis

Clearly Reading are the leagues strugglers when it comes down to going in at half-time in a losing position, with Southampton second.  Interestingly, both teams have controversially sacked their managers in recent weeks.  Does the chart make the decisions less controversial?  Surely its fair enough to sack a manager whose teams are consistently being beat at half-time?  We’ll come back to that.

Now we need to look at the final results when teams are losing at half-time and the distribution of these results.

 What if half time didnt exist... | Premier League Stats Analysis

 What if half time didnt exist... | Premier League Stats Analysis

It appears to be a tough ask to actually get a win when teams are losing at half-time (less than 1 in 10) which makes it intriguing that the team that have managed it the most are Reading, winning 3 times.  Again though, does this tell the full story?

A look at the total number of points gained from a half-time losing position may add some clarity.

 What if half time didnt exist... | Premier League Stats Analysis

At first glance it appears that Reading continue to lead the way in terms of grabbing points in the 2nd half of games, and even Southampton are performing better than some of the better established clubs such as Arsenal and Manchester City.  However, the figures can be skewed, for example, if a team is consistently losing at half time they are more likely (based on the averages) to be higher in the chart.

In order to remove this, we need to look at the points gained vs potential points available, i.e. the number of points available when losing at half-time against actual points won.

 What if half time didnt exist... | Premier League Stats Analysis

Unsurprisingly, it turns out that Manchester United are the Kings of the Comeback, winning 67% of potential points when losing at half-time.  Everton & Tottenham are performing well with 44% and 40% respectively, however with a league average of only 19%, Reading are still performing well with 23%.  Aston Villa bring up the rear having not gained a single point from 9 games where they were losing at half-time.  West Ham, Wigan, Liverpool & Norwich should also be concerned, having been in a losing position at half time in over 38% of their games.

Now its time to answer the original question of the post, “What if half-time didn’t exist”?

The assumption is that, without half time (and the various impacts that it brings), the position that teams are in after the final whistle is the same as at 45 minutes.

Below is the actual Premier League table as of 11/04/13.

 What if half time didnt exist... | Premier League Stats Analysis

The table below shows what the Premier League table would look like without half-time (or with points gained in the 2nd half after being in a losing position, removed).

Picture10 What if half time didnt exist... | Premier League Stats Analysis

The teams hardest hit are Southampton & West Ham, both dropping 3 places down the league, whilst the biggest gain belongs to Aston Villa who, due to others points being removed, actually climb 4 places.  Arsenal climb into the top 3 at the expense of Chelsea.

Whilst the best performing ‘half-time manager’ appears to be Sir Alex Ferguson, squeezing the highest points percentage out of the team, there has to be a special mention for David Moyes who has managed to squeeze points (9) out of 5 of the 6 games where Everton have been behind at half-time.